
ICE (2009)
Incidents Clustering Explorer
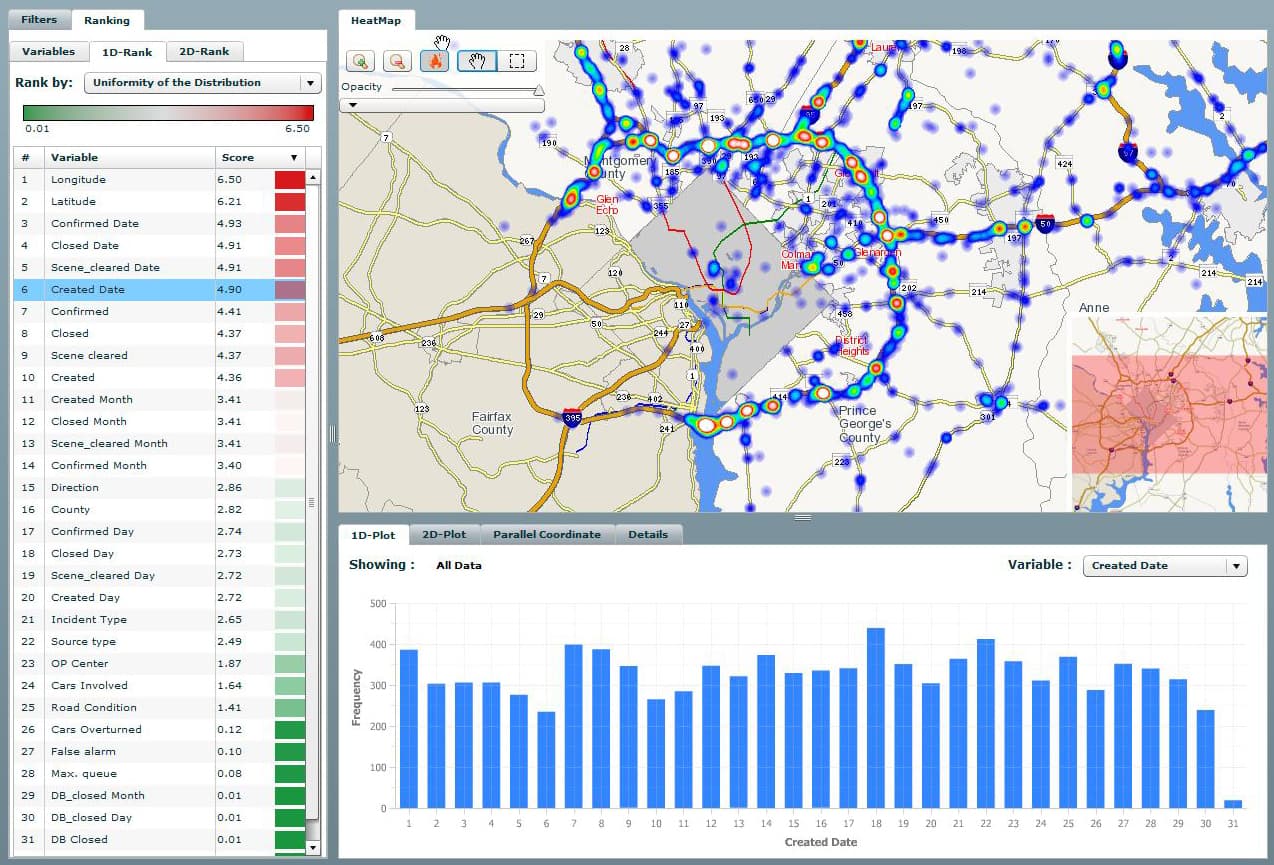
Description
Transportation systems are being monitored at an unprecedented scope which is resulting in tremendously detailed traffic and incident databases. While the transportation community emphasizes developing standards for storing this incident data, little effort has been made to design appropriate visual analytics tools to explore the data, extract meaningful knowledge, and represent results. Analyzing these large multivariate geospatial datasets is a non-trivial task. A novel, web-based, visual analytics tool called ICE (Incident Cluster Explorer) is proposed as an application that affords sophisticated yet user-friendly analysis of transportation incident datasets. Interactive maps, histograms, two-dimensional plots and parallel coordinates plots are four featured visualizations that are integrated together to allow users to simultaneously interact with and see relationships between multiple visualizations.
Members
Krist Wongsuphasawat and Michael Pack
Affiliation
Center for Advanced Transporation Technology Lab, University of Maryland
Link
- Project page on CATT Lab website
Related Publications
- Visual Analytics for Transportation Incident Datasets by Krist Wongsuphasawat, Darya Filippova, Michael VanDaniker, Michael L. Pack and Andreea Olea. in Transportation Research Record: Journal of the Transportation Research Board. Vol. 2138, pp. 135-145, 2009.
- ICE--Visual Analytics for Transportation Incident Datasets by Michael L. Pack, Krist Wongsuphasawat, Darya Filippova and Michael VanDaniker. in Proc. IEEE International Conference on Information Reuse and Integration (IRI), Las Vegas, NV, USA, 10-12 August 2009