Loading...

Projects

Project thumbnail
GoalRiver

All goals from all EURO2020 matches and the scorelines, minute-by-minute.

Project thumbnail
Encodable

Configurable grammar for visualization components

Project thumbnail
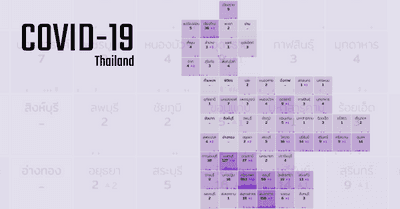
COVID-19 Situation in Thailand

A report of COVID-19 situation in Thailand based on open dataset, updated daily
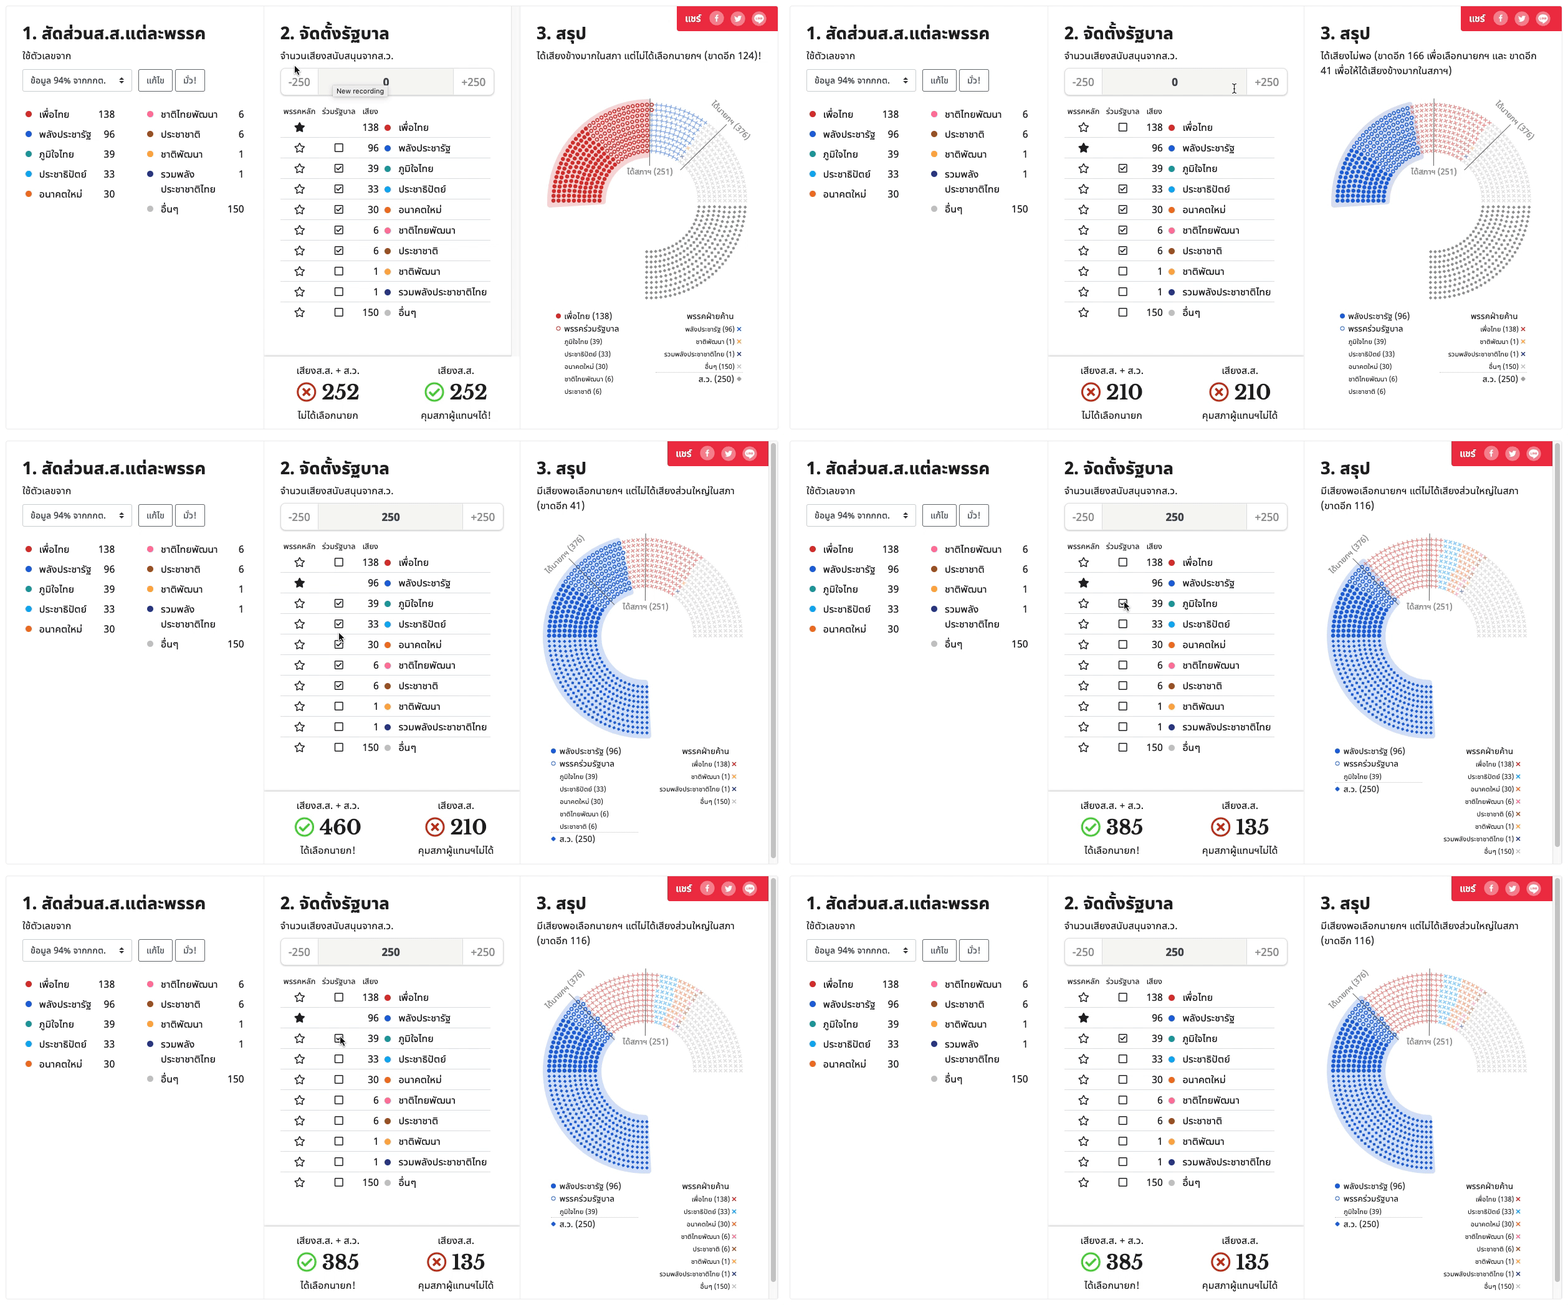
Simulate the political party combination to form the government of Thailand
Thailand Election Simulator

Simulate the political party combination to form the government of Thailand
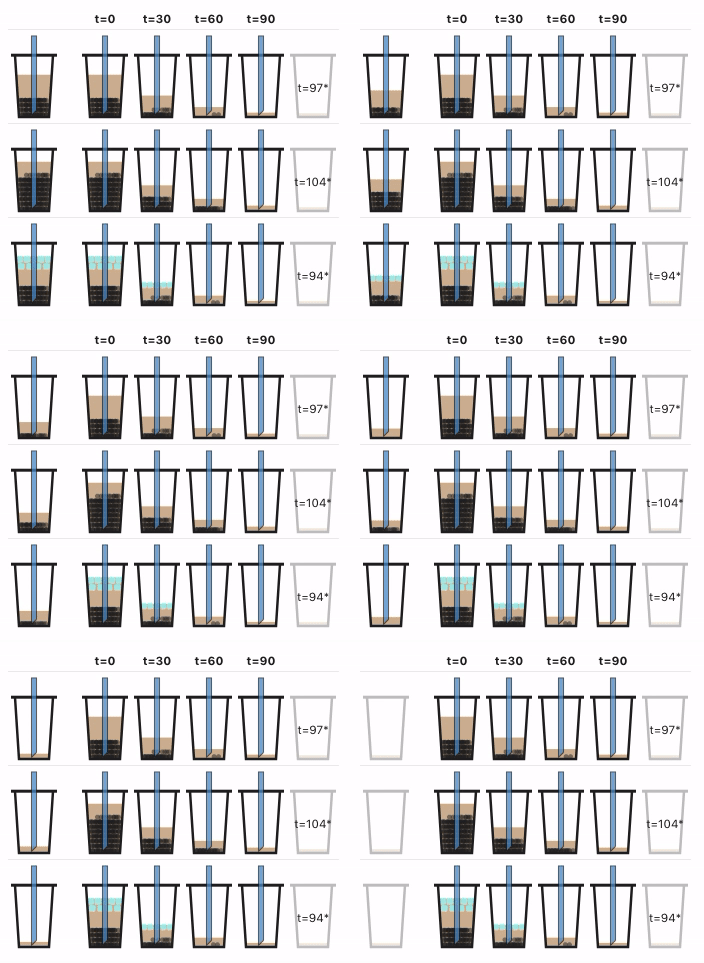
How Can I Drink Bubble Tea Without Finishing the Tea Before the Bobas?
Boba Science

How Can I Drink Bubble Tea Without Finishing the Tea Before the Bobas?

Project thumbnail
Guess companies from the colors

A simple game to demonstrate the values of user interaction logs.

Project thumbnail
Winter is here

Encode #GoT characters as snowflakes and revisit the most discussed moment for them.

Project thumbnail
Vega Desktop

A desktop client for viewing data visualizations created via Vega and Vega-Lite.

Project thumbnail
SentenTree

An open-source library for novel text visualization technique

Project thumbnail
International Migrants & Refugees

from each country's point of view, based on @UNICEF data

Project thumbnail
Mess-y-Map

Weave the world with messy lines

Project thumbnail
EURO2016

The Goals of EURO 2016

Project thumbnail
Game of Thrones

How every #GameOfThrones episode has been discussed on Twitter

Project thumbnail
#BestWorstViz

Award-winning terrible piece carefully created for @visualisingdata's contest

Project thumbnail
Twitter 10 years

Twitter Turns 10: How Tweets spread across the world

Project thumbnail
Standings Tracer

Visually explore ranking changes in football/soccer seasons

Project thumbnail
Oscars 2016

Ranking the nominees by amount of conversation on Twitter

Project thumbnail
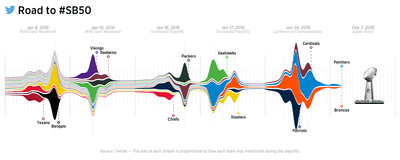
Road to #SB50

A streamgraph of Twitter activity during the NFL playoffs

Project thumbnail
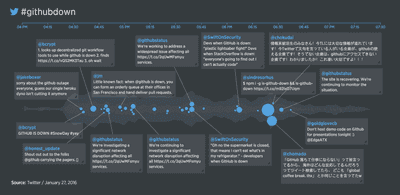
TweetFlux

Flow of Tweets when github was down based on the FluxFlow algorithm

Project thumbnail
d3Kit Timeline

A timeline component that labels do not overlap

Project thumbnail
Grid Map Quality

Quality metrics for Grid Map and a case study comparing layouts from 6 publishers

Project thumbnail
Create a custom Grid Map

A semi-automatic approach for creating a custom grid map

Project thumbnail
Labella.js

A library for placing labels on a timeline without overlap

Project thumbnail
#NFL fans on Twitter

#NFL2014: where are your team's followers?

Project thumbnail
Game of Tweets

In the Game of Tweets, you tweet or you die.

Project thumbnail
History of Champions League Finals

All European Cup and UEFA Champions League Finals since 1956, visualized.

Project thumbnail
d3Kit

A set of simple tools to speed up visualization development with D3.js

Project thumbnail
Premier League fans on Twitter

@PremierLeague: where are your club's followers?

Project thumbnail
D3's Data Binding

My attempt to visualize and explain D3's selection

Project thumbnail
#NBA fans on Twitter

#NBA: where are your team's followers?

Project thumbnail
Flying Sessions

Visual analytics tool for analyzing Twitter user activities

Project thumbnail
Scribe Radar

Visual analytics tool for monitoring and exploring log events at Twitter

Project thumbnail
Replay #WorldCup2014 on Twitter

Relive the entire #WorldCup with this visualization of Twitter data.

Project thumbnail
New Year 2014

Tweeting Happy New Year around the World

Project thumbnail
UEFA Champions League

Games, Goals and Tweets

Project thumbnail
Ben & Muu+'s Wedding Site

My wedding website

Project thumbnail
European Bubbles

Visualizing the European Financial Crisis

Project thumbnail
The Moviesualization

Interactive collection of movies

Project thumbnail
Minerals of the World

Learn about benefits and future of minerals

Project thumbnail
Outflow

Exploring Flow, Factors and Outcomes of Event Sequences

Project thumbnail
LifeFlow

Understanding Millions of Event Sequences in a Million Pixels

Project thumbnail
Visty

Network Stack Visualization

Project thumbnail
ICE

Incidents Clustering Explorer

Project thumbnail
MedCommix

Visualizing Aggregations of Patient Cohorts

Project thumbnail
Fervor

Exploring Clusters in Geospatial Datasets

Project thumbnail
HeapX

Heap Usage Visualization for Multi-thread

Project thumbnail
Similan

Query Similar Event Sequences by Example

Project thumbnail
SchoolAppOrg

School Application Organizer

Project thumbnail
Mission Possible

Speech Preparation and Synthesis Application for Thai Language

Project thumbnail
Plasma-Z

RoboCup Soccer Team

Project thumbnail
E-Zzz Poll

Mobile Questionnaire System