

GoalRiver (2021)
All goals from all EURO2020 matches and the scorelines, minute-by-minute.


Description
This project was an attempt to prototype a new way to summarize multiple soccer/football matches and goals into a single data visualization. A lot of existing visualizations focus on the final result, but not much about when things happened during the matches.
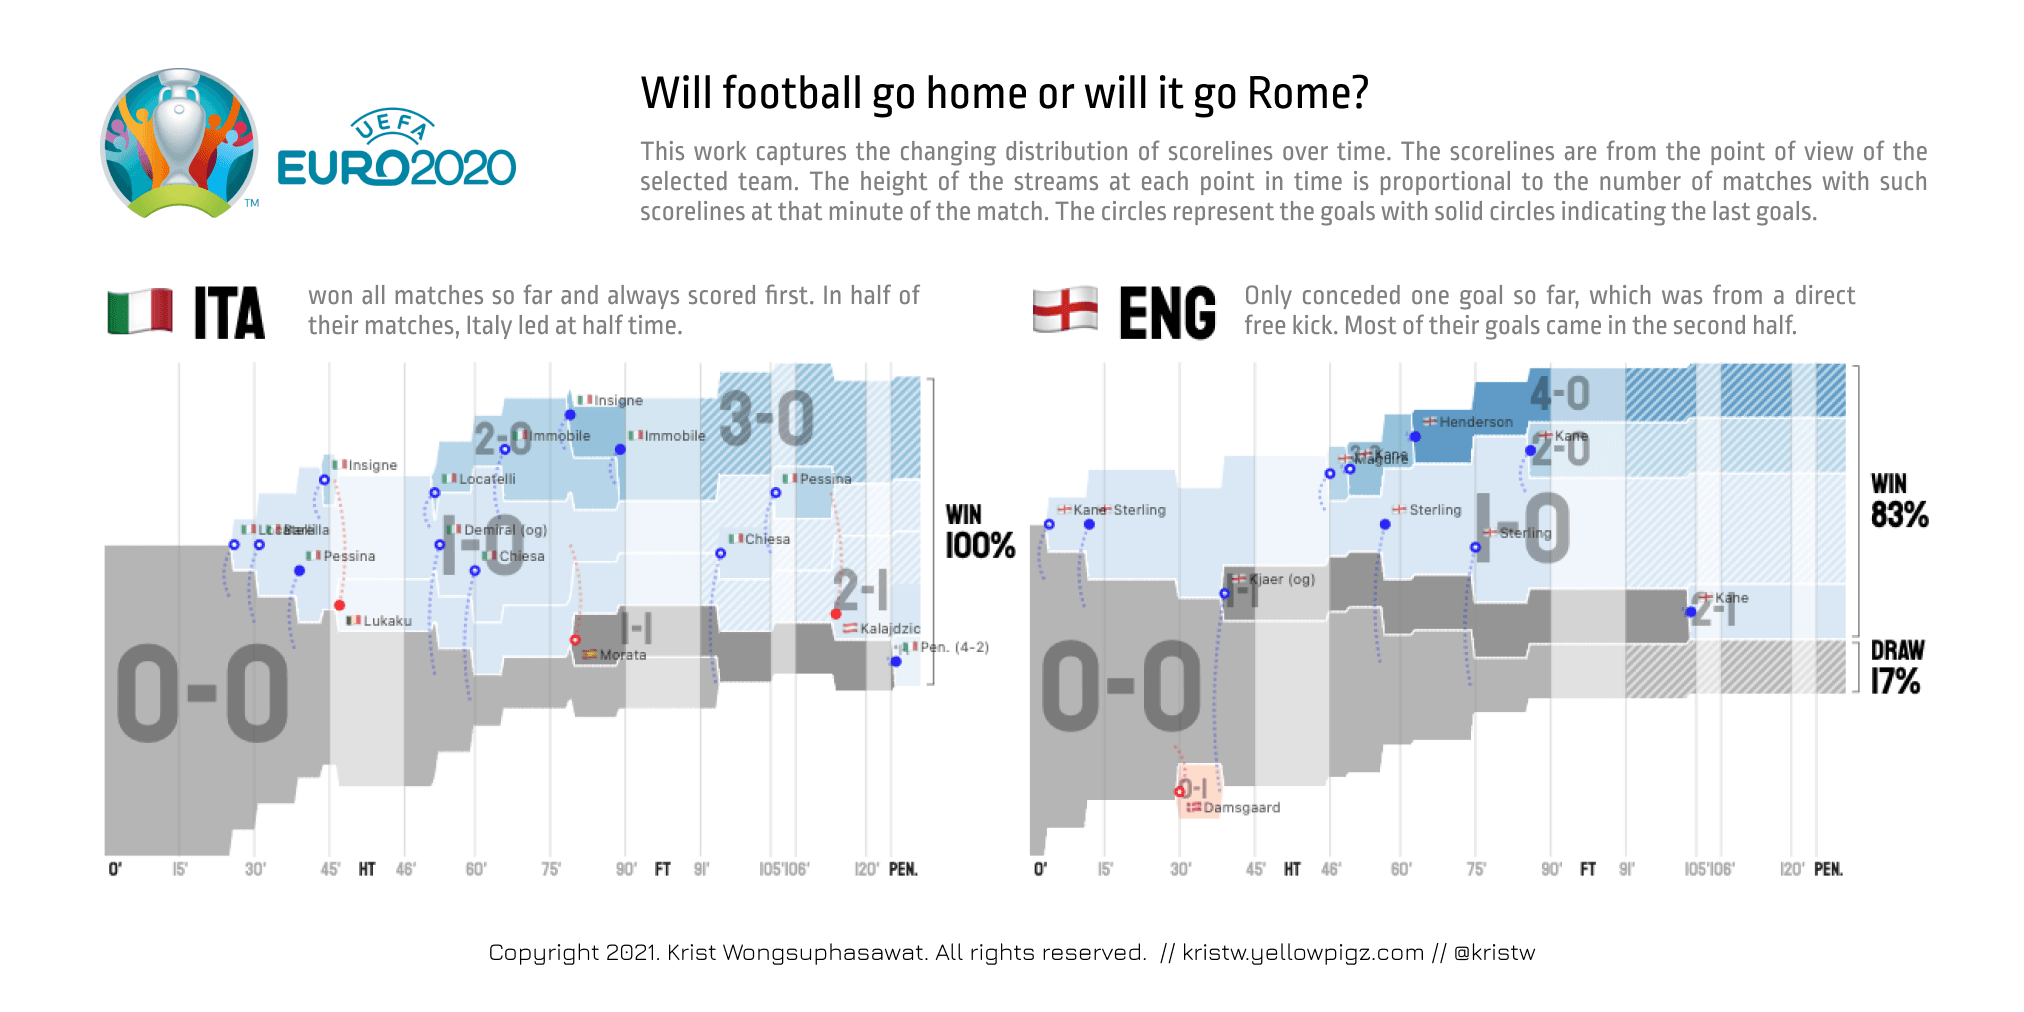
Although all the matches start at 0-0, they can end very differently. This work captures the changing distribution of scorelines over time, as well as the goals. The scorelines are based on the team that score first, so we can easily spot the “comeback” situations.
Each stream represents a scoreline and is colored based on its outcome and goal difference. The height of the streams at each point in time is proportional to the number of matches with such scorelines at that minute of the match. The circles represent the goals. Solid circles indicate the last goals of the matches. The trails show the previous scorelines before the goals.
It can also be used for comparing the performance of multiple teams.
All graphics shown here are programmatically created (except the manually curated narrative) and can be reproduced for other tournaments, given the data.
Link to Twitter thread