
News
Gave guest lectures in Dr. Puripant Rujikajorn's Data Visualization class at Chulalongkorn University Business School.
Guest lecture and mini workshop on Data Visualization Libraries in Dr. Alark Joshi's Data Visualization class at University of San Francisco.
GoalRiver was included in Information Is Beautiful Award long-list + Critique from Nadieh Bremer
Guest lecture in Amy Cesal's Data Analytics and Visualization Graduate Program at Maryland Institute College of Art (MICA).
Presented "Navigating the Wide World of Data Visualization Libraries" at Data Council Bangkok Meetup.
Released htmltojsx-too library to resolve security issues of the legacy htmltojsx package which was no longer maintained.
Panelist at VisInPractice Workshop in IEEE VIS 2021: Tools of the Trade / Recording
GoalRiver was well received on Twitter and mentioned as new stunning data visualization examples to see and learn from by AnyChart.
Guest lecture and mini workshop on Data Visualization Libraries in Dr. Alark Joshi's Data Visualization class at University of San Francisco.
Paneled "The Power of Data Visualization: เปลี่ยนข้อมูลให้เป็นเรื่องใกล้ตัว เล่าให้ชัวร์! ว่าคนอื่นเข้าใจ" on Facebook live, hosted by Skooldio.
Presented "What I tell myself before visualizing" at DataFest Tbilisi.
Presented "Encodable: Configurable Grammar for Visualization Components" (Best Paper Honorable Mention) at IEEE VIS 2020.
Gave a guest lecture in Dr. Marti Hearst's Data Visualization class at UC Berkeley.
Gave a guest lecture in Dr. Puripant Rujikajorn's Data Visualization class at Chulalongkorn University.
Become Apache Superset Committer.
My article "How can I drink a bubble tea to ensure that I don’t finish the tea before the bobas?" was featured by Medium.
Gave a guest lecture in Dr. Adam Perer's class at the University of Pennsylvania (remotely).
Published an interactive for the Game of Thrones season 7 premiere "Winter is here".
Featured in the book "Data Visualization for Success: Interviews with 40 Experienced Designers".
Co-present BkkViz, visualizations of Bangkok open data in "SleepOver#5: YouPin - Viz City Series" at The Reading Room, Bangkok.
Gave a talk "Storytelling with data" at Chulalongkorn University in an event hosted by Faculty of Communication Arts and Faculty of Engineering.
Gave a talk at D3 Bay Area User Group Meetup, hosted by Andreessen Horowitz in Menlo Park, CA
Published an interactive about Game of Thrones and was featured on Entertainment Weekly, The Next Web, Gizmodo, Flowingdata and many other publishers around the world: USA, UK, Germany, Czech, Portugal, Spain, Australia, New Zealand, etc.
Won the contest to design #BestWorstViz held by @visualisingdata
Gave a guest lecture in Prof. Marti Hearst's Information Visualization class at UC Berkeley
Published an interactive for Twitter 10th birthday and was featured on Mashable
Gave a guest lecture in Prof. Rahul Basole's Information Visualization class at Georgia Tech (remotely)
Published an interactive for Oscars 2016 and was featured on Entertainment Weekly
Published a blog post "Visually explore funnels of user activities" on Twitter Engineering Blog
Open source Labella.js, a library for placing labels on a timeline without overlap.
Gave a guest lecture in Prof. David Gotz's Information Visualization class at University of North Carolina, Chapel Hill (remotely)
Game of Tweets was publicly displayed Twitter #Flight Conference.
Gave a talk at "Big Data Visualization - South Bay" Meetup, hosted by CA Technologies in Santa Clara, CA
"Twitter Premier League map" was published on Twitter blog and featured on The Guardian, Mirror, Telegraph, ESPN, Sky Sports, Independent, CNN, Premier League, etc.
Gave a talk in the event "CodeMania X2: Data Science 101" at Faculty of Engineering, Chulalongkorn University. Videos from the session are on YouTube.
"Twitter NBA map" was published on Twitter blog and featured on Mashable, The Bleacher Report, NBC Sports, Sports Illustrated, Yahoo!, SB Nation, etc.
"Twitter NFL map" was published on Twitter blog and featured on USA Today, Mashable, The Bleacher Report, ESPN, NFL, 49ers.com, etc.
Presentation "Data Visualization at Twitter" was featured on the Slideshare homepage. screenshot
Interviewed by Digilife.tv by @spin9. See video on YouTube.
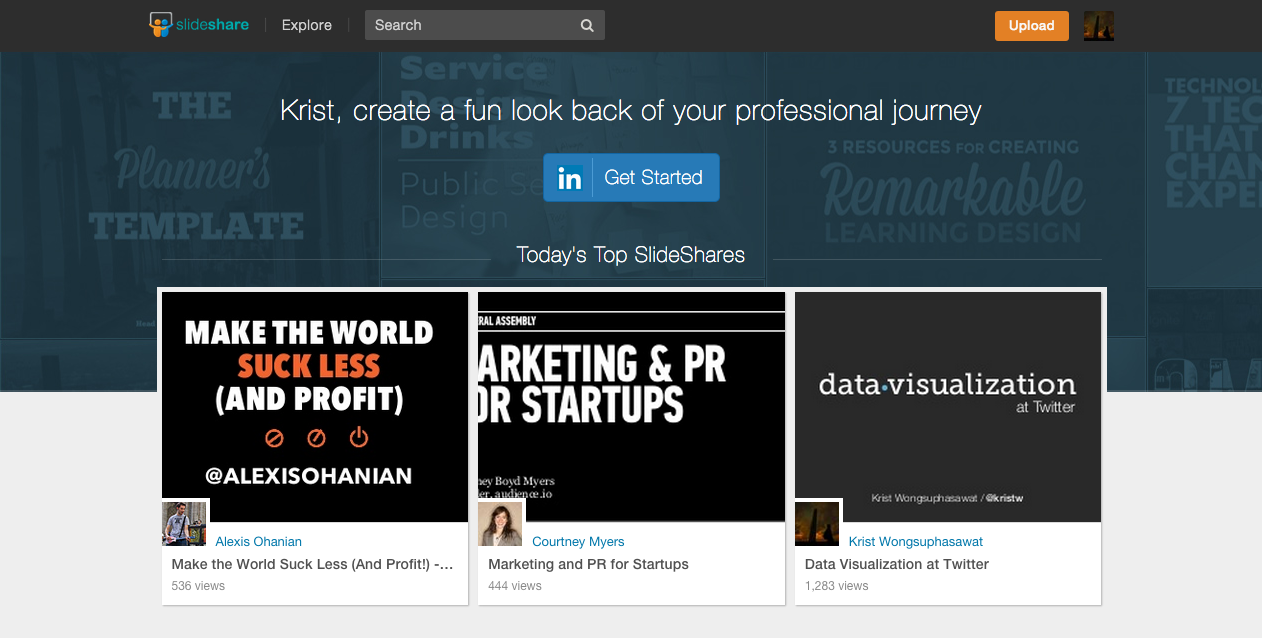
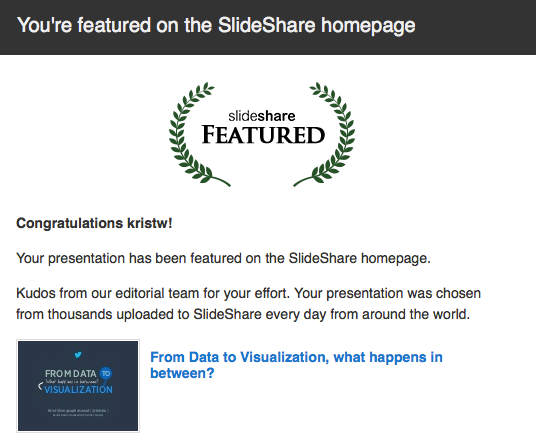
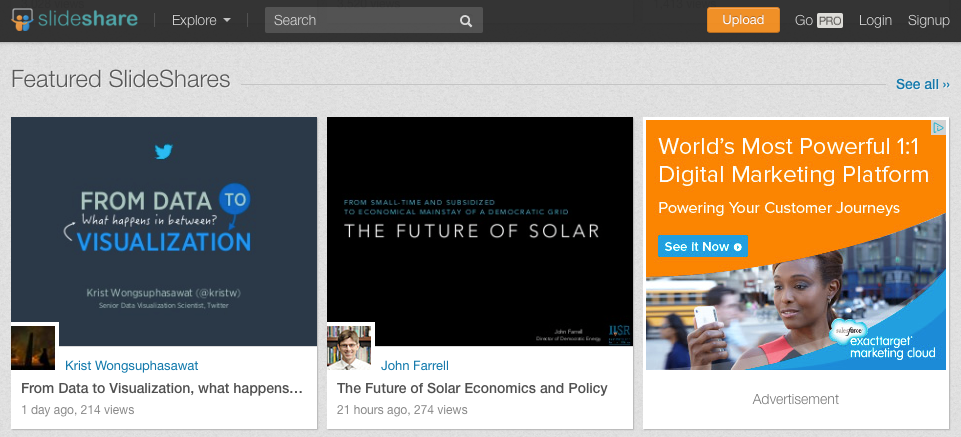
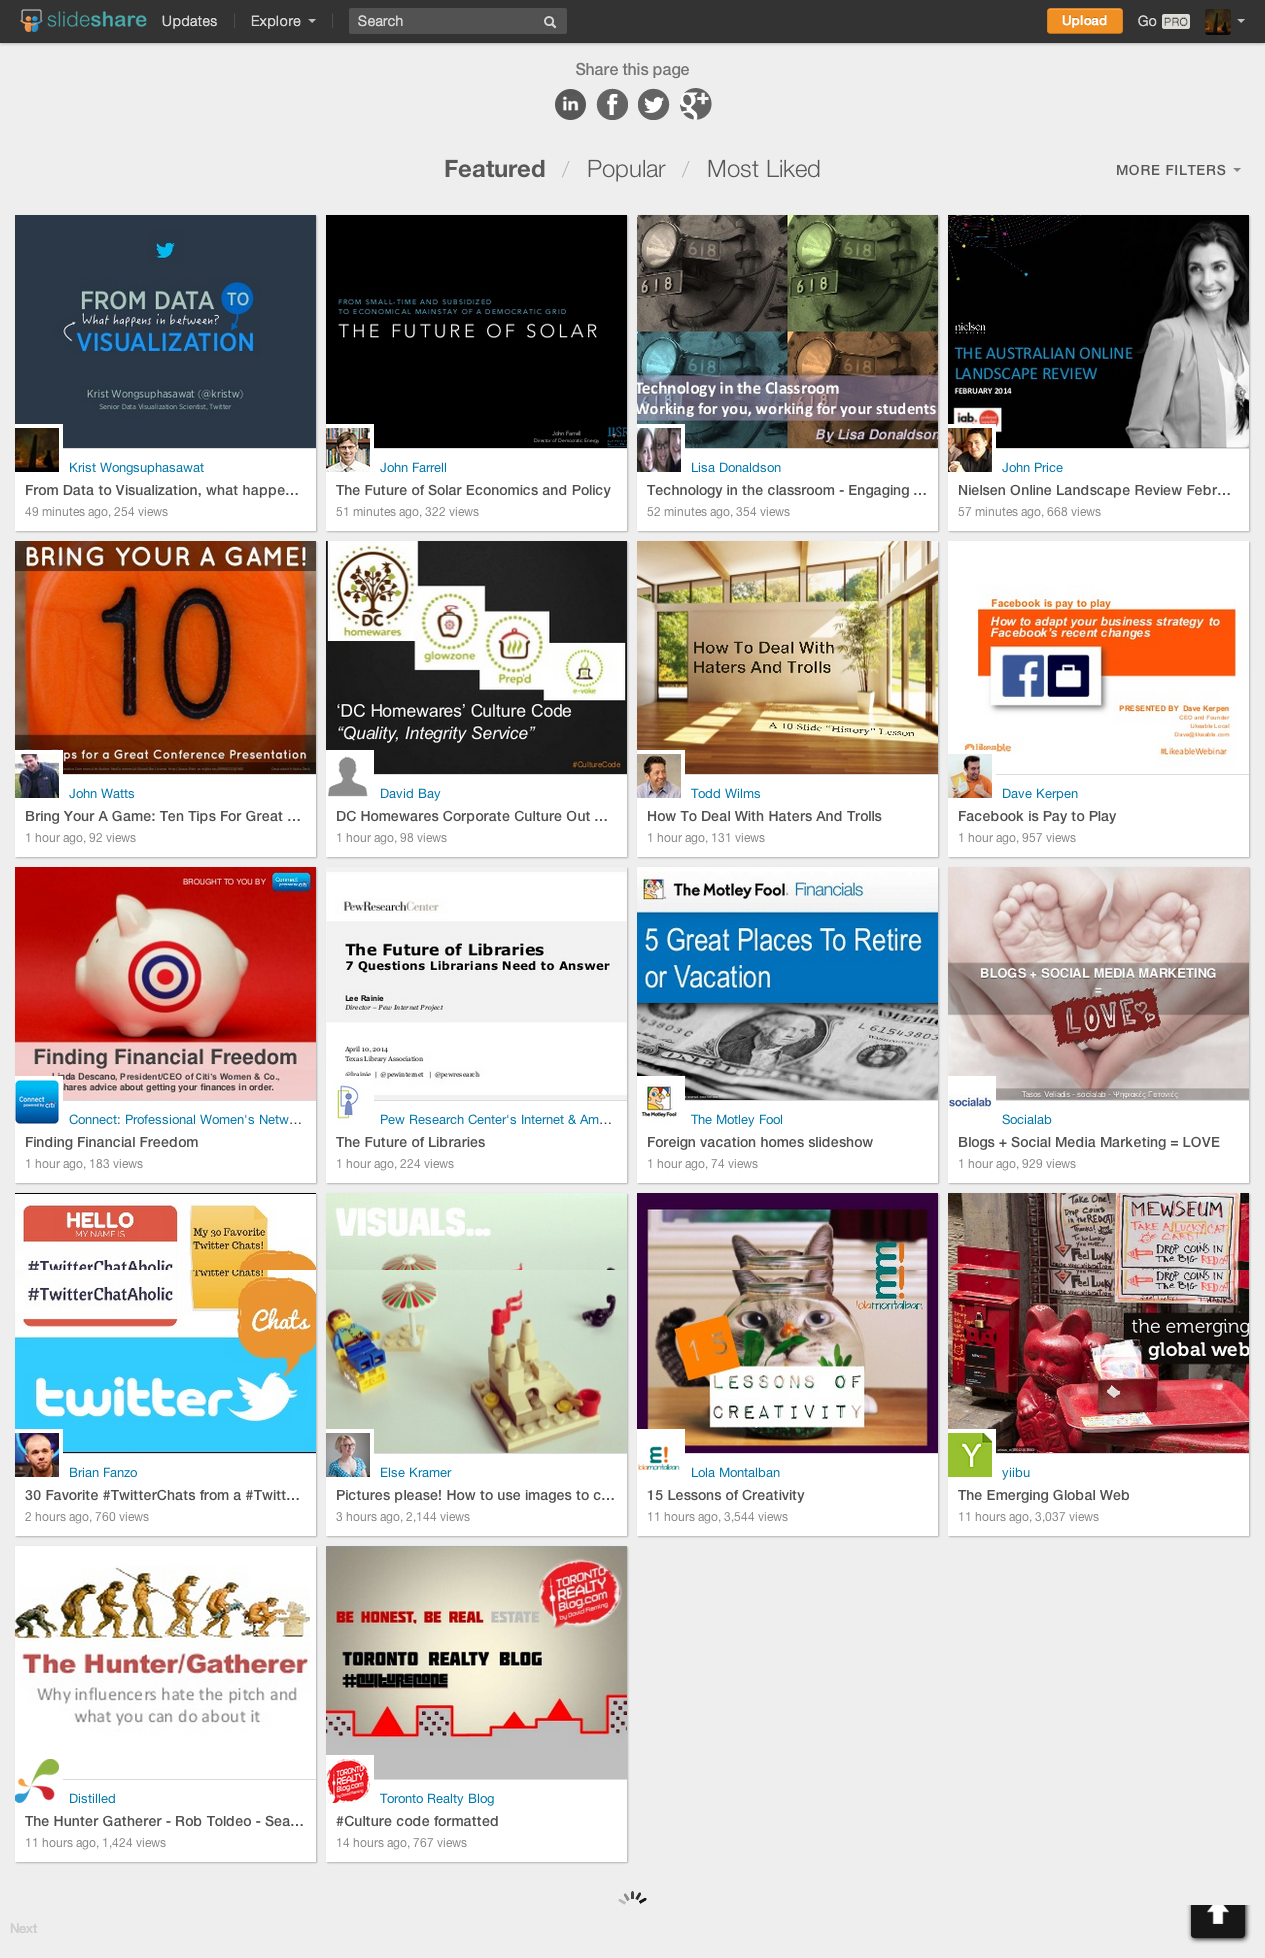
Presentation "From Data to Visualization, what happens in between?" was featured on the Slideshare homepage. Screenshots #1 #2 #3
Interviewed by Nation Radio FM 90.5 MHz Bangkok.
"Tweeting Happy New Year around the World", a visualization of new year celebration on Twitter was published on Twitter blog and featured on The Guardian, Mashable, Flowingdata, visual.ly, etc.
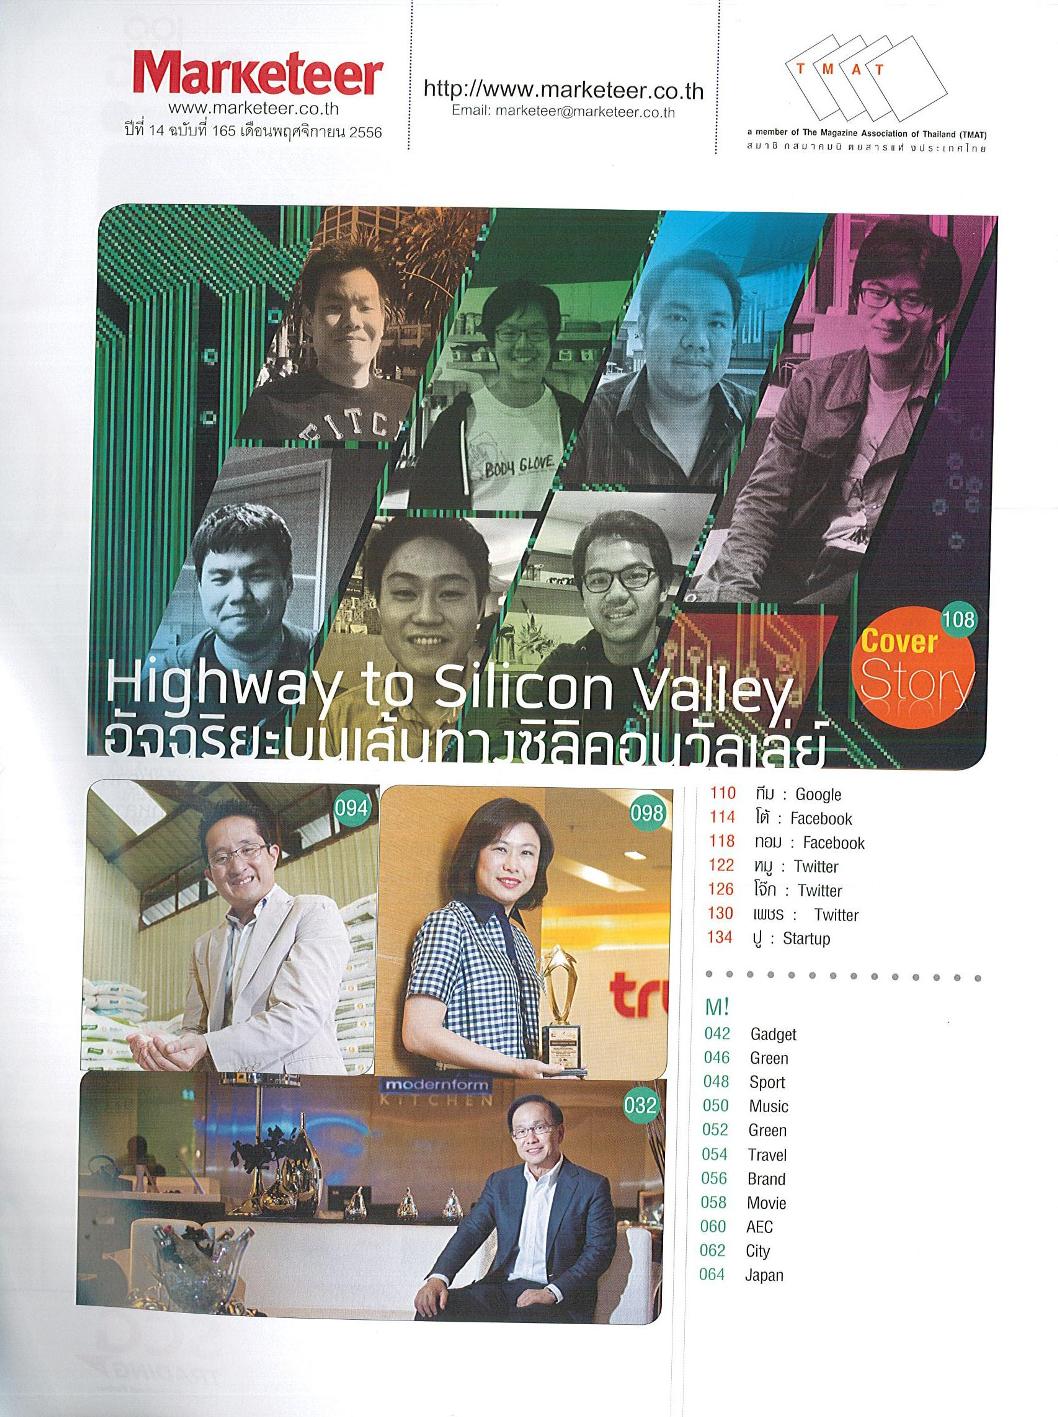
Interviewed by Marketeer Magazine (Vol.14 No.165 November 2013) in column "Highway to Silicon Valley". (image)
"Road to Wembley 2013: Games, Goals and Tweets", a visualization of Twitter data for the UEFA Champions League Final was published on the Twitter UK Blog and featured on visual.ly.
Interviewed by Bangkok Business News TV in Thailand for the "Business Talk" program. View the clip here.
Interviewed by the Nation newspaper in Thailand for the column "Byteline & Technology". View the article here.
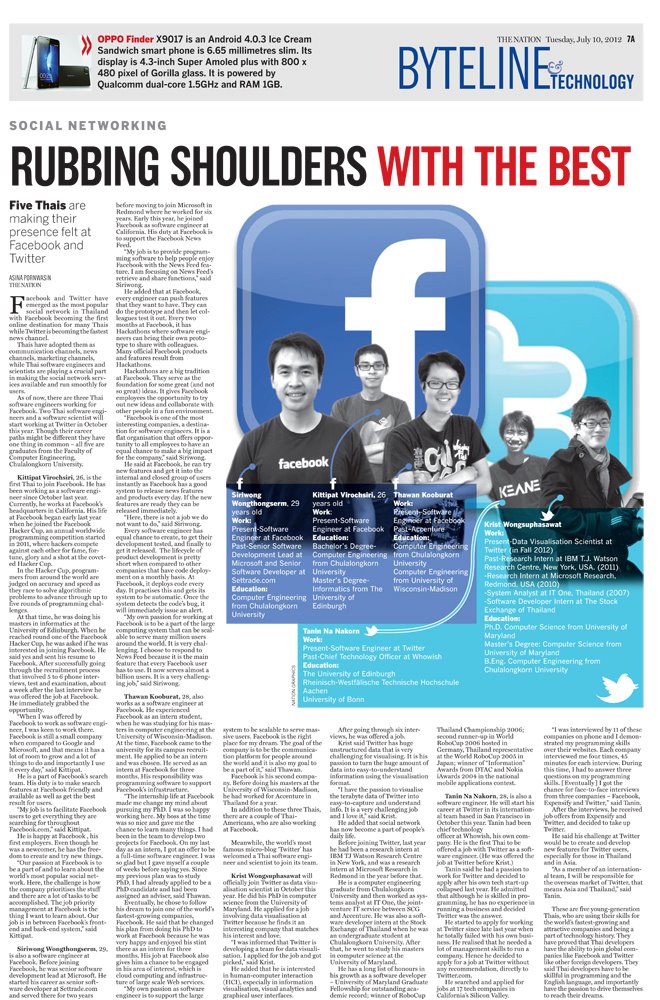
"European Bubbles", won the interactive category in the data visualization challenge "Money Panic" held by informationisbeaultifulawards.com
Slides from my talks are now available on slideshare.net.
"Minerals of the World", was shortlisted in the data visualization challenge "Stock Check" by informationisbeaultifulawards.com